In order to properly expose an image, you need to understand how to read a histogram.
The LCD screen on the back of your camera doesn’t give you an accurate representation of what your pictures looks like.
If you’re shooting tethered to Lightroom or Capture One Pro (and if you are a food photographer, I hope you are!) you still may not know if your images are properly exposed.
LCD screens and laptop monitors are not good at conveying exposure because they are affected by the brightness and glare of the screen and the ambient lighting conditions where they are being viewed.
When you understand how to read a histogram, you know exactly how evenly exposed a photo is.
It can take a bit of getting used to, but eventually a glance at a histogram will tell you how to adjust your camera settings.
What Is a Histogram?

A histogram is a mathematical representation of the tonal range found in an image.
Tonal range refers to the number of tones between the darkest part of your image to the lightest.
It maps out brightness on a grayscale. Black appears on the left, white is on the right. All the shades of grey are found in between.
Each image file has a scale of values of brightness.
A histogram maps out the given brightness values; each pixel from the image is assigned to a value.
For example, a standard.jpg image records 256 different values of brightness: 0 is pure black, while 255 is pure white. If that sounds like a lot, it’s not. A RAW file has up to 16,384 brightness levels recorded by each pixel, which is why they they offer so much flexibility in terms of editing.
The height of each column on the vertical (Y) axis is determined by how many pixels are assigned to that column.
How to Read a Histogram
A colour photography histogram has three colours: red, green, and blue. The histogram will appear grey where they overlap.
The image of the apple pie below has been correctly exposed and the majority of the pixels are away from the black and white values in the histogram. What may appear to be black in the photo is actually just a very dark shade of grey.
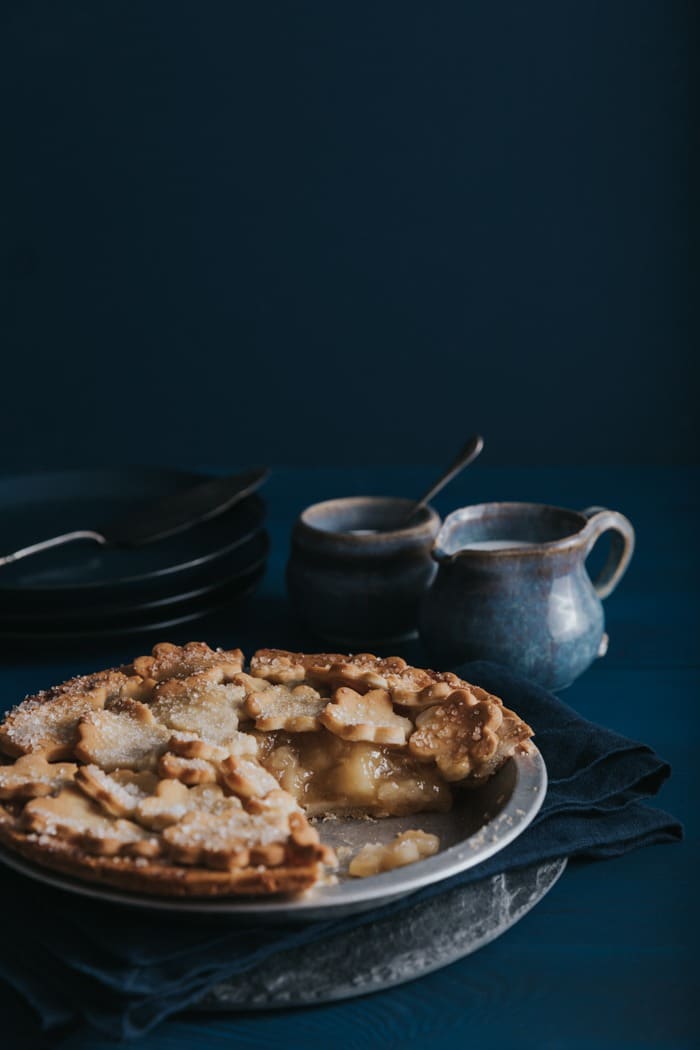
This is a “dark and moody” style of photo, which is why the majority of the pixels appear on the left-hand side of the histogram.
However, you can tell that I didn’t lose detail information because there is a gap between the assigned brightness values at the very ends of the histogram. The columns don’t touch the end.
When you have pixels touching the very end of the histogram, it means that the image is underexposed or overexposed. You’re missing details that you can’t recover in post-processing.
One thing I should point out is that when I do my signature dark and moody style of food photography, I always underexpose a little bit. This allows me to deepen the shadows and create that mysterious atmosphere I’m going. I brighten the food in post, as it is my subject and I want the shadows to pull the eye to it.
Now, take a look at the following images with their respective histograms.
I included the final edits to show you what I was able to do in post, but in general you should strive to get things right in camera whenever possible.
Underexposed Image
Overexposed Image
Clipping
Lightroom has a clipping warning that you can turn on to warn you where you are losing detail in your images.
These are the little triangles in upper corners of the histogram.
Simply click on each triangle to activate it.
When the triangles change colour, Lightroom is warning you that you’re losing detail. When the triangle is white, you have lost detail.
It will also indicate this in the image itself; red shows blown out area, whereas blue shows the areas where you are missing shadow detail.

It’s worth noting, however, is that you’ll want to make creative decisions along with the information from your histogram and the clipping warnings in Lightroom. Sometimes clipped shadows don’t matter in an image.
The same is true for blown out highlights, say in a backlit image. It’s up to you to decide as an artist when a loss of detail is negatively affecting your exposure.
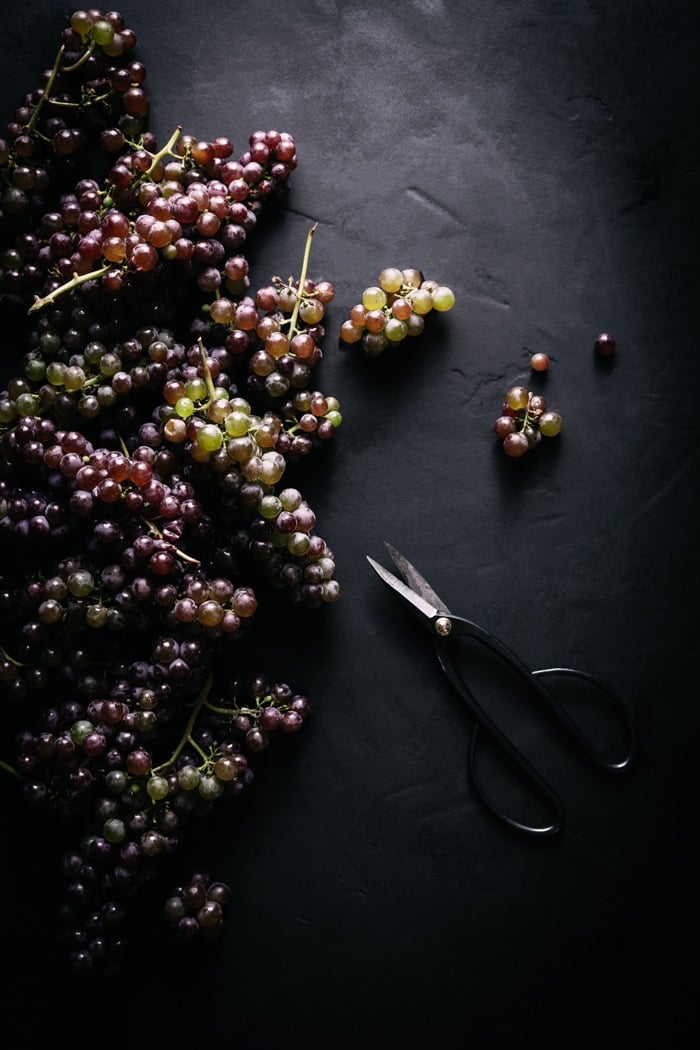
In the image of the grapes below, you can see that I have some clipped shadows and that my most of my tones are on the far left of the histogram. This is because it’s a dark and moody image.
I wanted to draw the viewer’s eye to a particular part of my frame and didn’t mind if some of my subject was cloaked in shadow or if I was losing shadow detail in some areas.
RGB
Many cameras have a single histogram but to really get an accurate reading of your exposure you need to look at your histograms in three channels of colour: red, green, and blue. This is known as RGB.
The RGB histogram maps out each colour channel.
An ordinary histogram lumps these all together, so you don’t know if you are overexposing or underexposing a specific colour.
Look at each channel’s histogram to ensure that the graph isn’t bunching up to one side.
Each colours histogram will be different from image to image, as photos all have different colours with varying brightness.
It’s especially important to use the RGB histogram when shooting brightly coloured subjects, Otherwise you can blow out the corresponding colour channel without it showing up in the main histogram.
You can end up overexposing the image and losing information.
To Sum Up
The next time you shoot, turn on the histogram view function on your camera and monitor your histograms.
Getting things right in camera will cut down on the amount of time you spend editing and you will not be relying on Lightroom or Photoshop to fix things you can get right in camera.











3 Responses
Hi Darina! This article is exactly what I need. Thank you. I’m trying to understand how the histogram should look like for the dark & moody style. Unfortunately, all of the photos of histograms are broken. Please would you be able to reload/fix them? Thank you in advance! I love all your work.
Hi Magda. It really depends on the image. Lighter images will have more info on the right, while darker images will have more info on the left. The import thing is that the info is not touching the sides, or you are getting clipping–missing details in your file. You can turn on the clipping warnings in Lightroom to make sure you are not losing shadow detail or blowing out your whites.
Thanks you for letting me know they are broken! I will relink them!